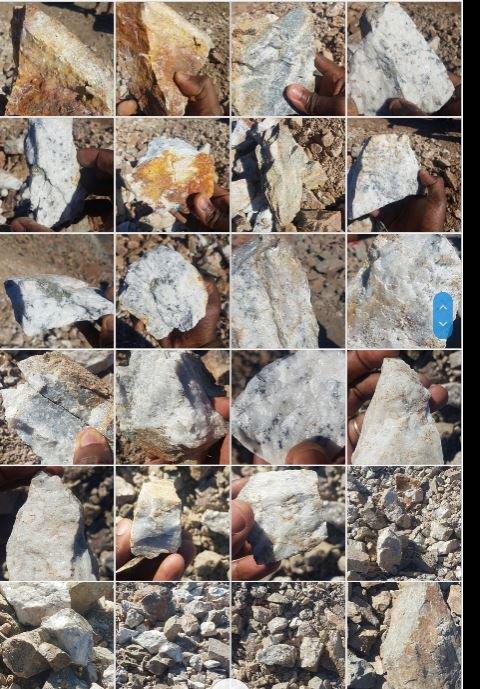
This was my report sometime last year of the state of my project
Background
Gold Fan Mining Pvt Ltd is the registered owner of Tula 14 mine located in Nkenyane Area of Bubi District in Matabeleland North Province. The proponent proposes to mine gold in the area, where access to the ore body will be through vertical shafts that will be linked underground through drives. The mined out gold ore will be transported to an offsite custom mill where it will be processed. Onsite milling can also be done using a hammer mill if it is available.
Objective
The Philosophy of the company is to commence mining whatever viable reserve is available and continue with exploration which would be financed internally to increase the resource since the potential of the area is overwhelming.
Project Description
The project will involve gold ore extraction from underground slopes where access will be through vertical shafts that will be linked underground using drives. Explosives will be used for blasting purposes and the ore will be hoisted out of the shafts then transported to the mill offsite for processing. The proponent will also build facilities that includes compound, toilets and offices onsite.
Prospecting Work Done to Date
A company called Diglosol Zimbabwe was engaged to do a geological survey of the claim and the general area. The geologist explored the area and conducted a magnetic survey and an I.P and Resistivity Survey. His conclusion was the area is mineralised and poses great potential for small to large scale investment.
Current Mining Activity in the Area
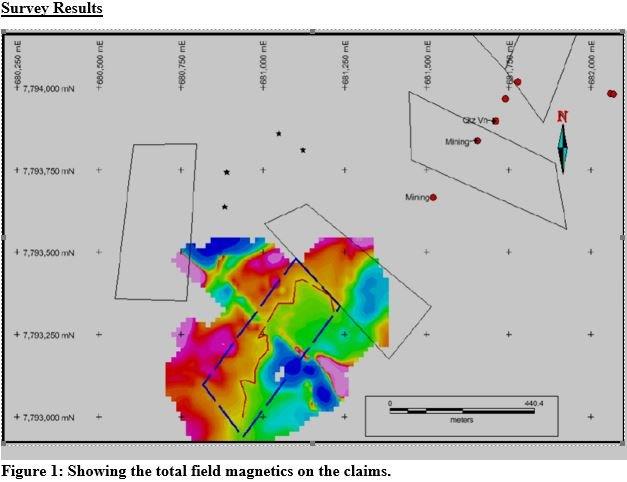
Miners in neighboring claims, shown by red dotted lines in figure 1 below, have managed to extract many kilograms of gold, with the most profitable extracts coming from depths after 35 meters. This is what attracted the company to explore the area. The artisanal miners mining along the same reef are getting around 300g of gold per week at depths of 40 plus meters. One miner got 300grams on 14/10/2016, 500g on 21/10/2016 and 380g on 28/10/2016 from his single shaft after taking approximately 5 tons of ore to the stamp mill on each occasion.
Brief Geology of Claim
The host geological environment includes volcano-plutonic and clastic sedimentary tectonostratigraphic terranes. The host rocks have been characteristically metamorphosed up to green-schist facies conditions. The gold deposits typically occur within or in the vicinity of regional, crustal-scale deformation zones with a brittle to ductile type of deformation.
The geologic structures generally indicate compressional to transpressional tectonic settings.
The area is predominantly confined to intrusive rocks. There are greenstones that flank the north-western boundary of the hosting unit. The emplacement resulted in pro-grade north-east trending structural deformation.
Magnetic Survey
Brief Theory
Because of its high sensitivity to magnetic mineral content, the magnetic technique is used to map the general geology and structural setup sense. Different rock types contain varied proportions of the magnetic minerals such as magnetite, pyrrohtite, ilmenite or none at all.
This method can be used to map out variations within the same rock that are largely due to alteration i.e. oxidation. Structural controls of the investigated area such as faults and ***** can also be mapped, which are interpreted as lineaments thus making it a good mapping tool especially for areas with poor outcrop exposure.
Total field measurements were achieved by use of two GSM19 magnetometers, one as a base station to monitor diurnal variations during the survey and the other as the field measuring instrument. The base unit was set to sample every 30 seconds while the field unit sampled every second on the walk mode. An on board GPS was used to pick up coordinates for every sample collected by the field unit.
Survey Results
Figure 1: Showing the total field magnetics on the claims.
The illustration in fig1 shows part of the structural controls in the area together with the current mining activities. There are predominant north to north east structural controls that are in the area which control the main mining activities.
The results of the survey also indicate a defined structure (marked by the red dashed line) dominantly with the same trend and geologic strike extension as the current mining activities. This structure is the potential reef host in the claim block. At the northern end of the claim the structures show a right stepping displacement deformation.
The current mining activities are marked by the red dots in the illustration above, which follow a defined north-east trend. Despite the current mining activity trend, the kinked sections of the proposed reef system pose great potential for high grade mineralization as there is enhancement of the structural controls. The potential reef system shows evidence of continuation further south of the claim boundary.
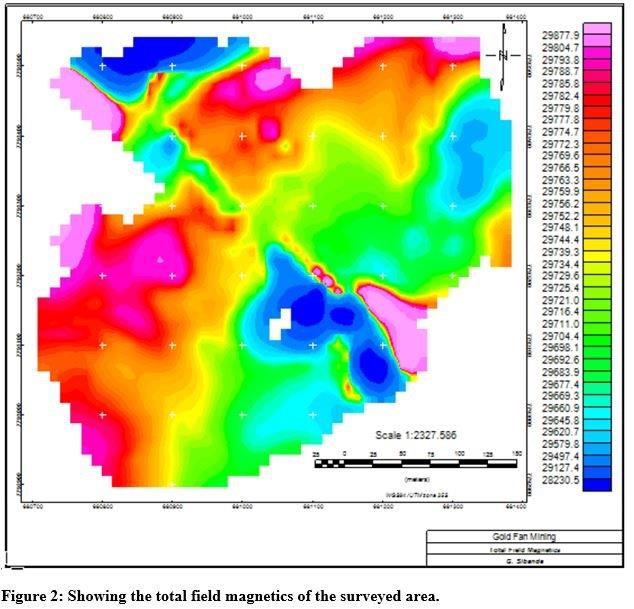
Figure 2: Showing the total field magnetics of the surveyed area.
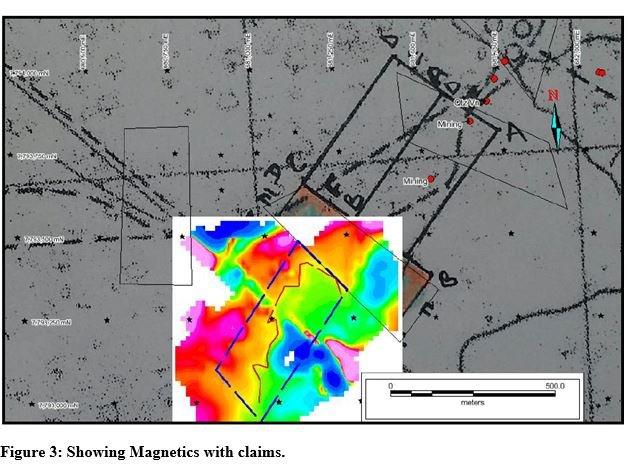
Figure 3: Showing Magnetics with claims.
Conclusion
The area in question is mineralized and poses great potential for small to large scale investment.
There are several structural controls within the country rock but the predominant are the north to north-east trending.
The north-east trending structure host the current mining activities hence providing more confidence in the structures.
Induced Polarization (I.P.) and Resistivity Survey
Brief Theory
Induced Polarization & Resistivity surveys are excellent methods for detecting disseminated sulphide mineralization that could be associated with gold. Sulphide mineralization happens to be the main type of mineralization in the project area. It is also an important tool in directing drill-hole targets especially when used in conjunction with magnetics, structural and lithological geology maps and geochemical data.
Both measurements are made by introducing a controlled electrical current into the ground using two current electrodes, thus energizing the ground, and then measuring the induced potential-field gradient voltage at (between) two non-polarizable receiver electrodes. The distance between the pair of current electrodes and the pair of potential-field electrodes determines the depth of investigation.
The resulting voltages as a function of time (time-domain IP/TDIP), are recorded digitally and analyzed for the induced polarization effect. The measured IP phase indicates the ability of rocks to briefly hold an electrical charge after the transmitted voltage is turned off i.e. voltage decay or chargeability.
Survey Results
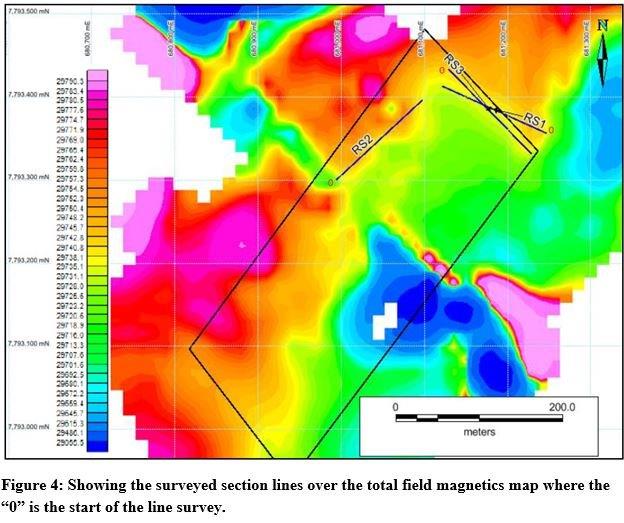
Figure 4: Showing the surveyed section lines over the total field magnetics map where the 0 is the start of the line survey.
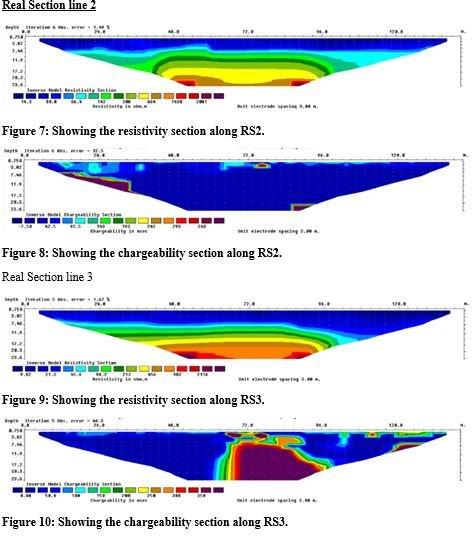
The illustration in fig4above shows the surveyed real section lines. The real section lines were planned to intersect the structure of interest (marked by the yellow shaded zones) at multiple points as shown above. All 3 lines were surveyed and named as shown above. The area of interest generally has a thick overburden hence the sections have 47.5m attenuated as they did not have significant results. That is to say the Y axis on the left-hand side of each of the sections below has its zero point 47.5m below surface and the X axis is the lateral length of the survey line with 0 marking the start of each line as shown in fig 7 above.
All the chargeability anomalies have nomenclature indicating the distance from the start point, name of the line and estimated depth of anomalous intersection. This is to say an anomaly named 72RS1D48 is 72m from start on line RS1 at an estimated depth of 48m. This nomenclature will be applied throughout the rest of the document.
Real Section line 1
The results of the survey conducted on RS1 are as shown in fig 5and 6below, as the resistivity and chargeability sections respectively.
The illustration in fig 5 below is of the results from the resistivity profile of the section line RS1. The first 65m from surface are fairly conductive but the last 6m are showing signs of increased resistivity.
Figure 5: Showing the resistivity section along RS1.
The illustration in fig 6 below is of the chargeability profile of the section line RS1. The anomaly at 24m from the start of the section line is also coincident with the intersection of the survey line and the structure. At 37m from start and at the attenuated depth of 11.9m there is a zone of significantly high chargeability.
Figure 6: Showing the chargeability section along RS1, with an example of anomaly nomenclature
This has a spike that is elevated close to the attenuated zero mark. That is a possible reef system that has potential of leading to a massive sulphide deposit. The illustration indicates several massive sulphide bodies along the length of the section marked by the zones of highest chargeability.
The illustration indicates several massive sulphide bodies along the length of the section marked by the zones of highest chargeability.
Real Section line 2
Figure 7: Showing the resistivity section along RS2.
Figure 8: Showing the chargeability section along RS2.
Real Section line 3
Figure 9: Showing the resistivity section along RS3.
Figure 10: Showing the chargeability section along RS3.
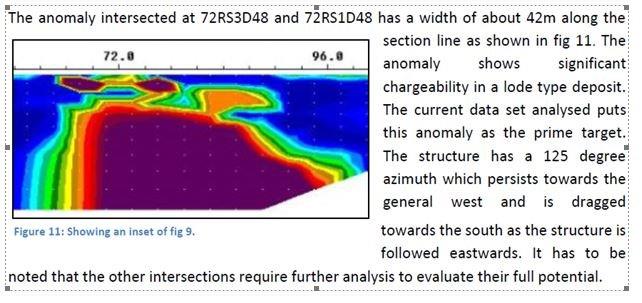
The gold mineralization of this area is associated with sulphide mineralization and on this premise the zones of highest chargeability have the greatest potential of profitable production.
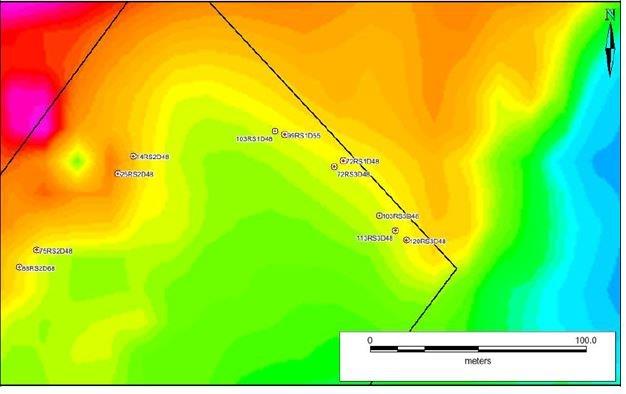
The illustration below is a summary of the intersections of note from the 3 lines surveyed projected to surface. The author assumes the reader can now correlate the target points on figure below with the relevant chargeability section in the illustrations above by use of the nomenclature.
The potential reef structure (marked by the yellow shade in the figure below) in the section investigated by RS1 and RS3 has a number of significant intersections.
Of note are the anomalies intersected at 72RS3D48, 72RS1D48 and 99RS1D55.
Conclusion
The results of the real section survey have confirmed that the mineralization in this area is structurally controlled.
There are several massive sulphide bodies within the section that indicate potential for ore-body type mineralization in the property area coupled with reef type mineralisation.
There is a general apparent westward dip of the structures, this needs to be resolved to normal for the actual dip.
Recommendation
To sink the first shaft targeting anomaly 72RS3D48 in the short term.
To systematically survey the anomalous structure along the length of the claim through real sections so as to come up with a 3D model of the ore body.
A couple of diamond drill holes can be planned to test the mineral potential of the property.
Close monitoring of analysis and modelling of the mineralisation of the property is highly recommended.
Further analysis of the other structural trends within the property.


